...
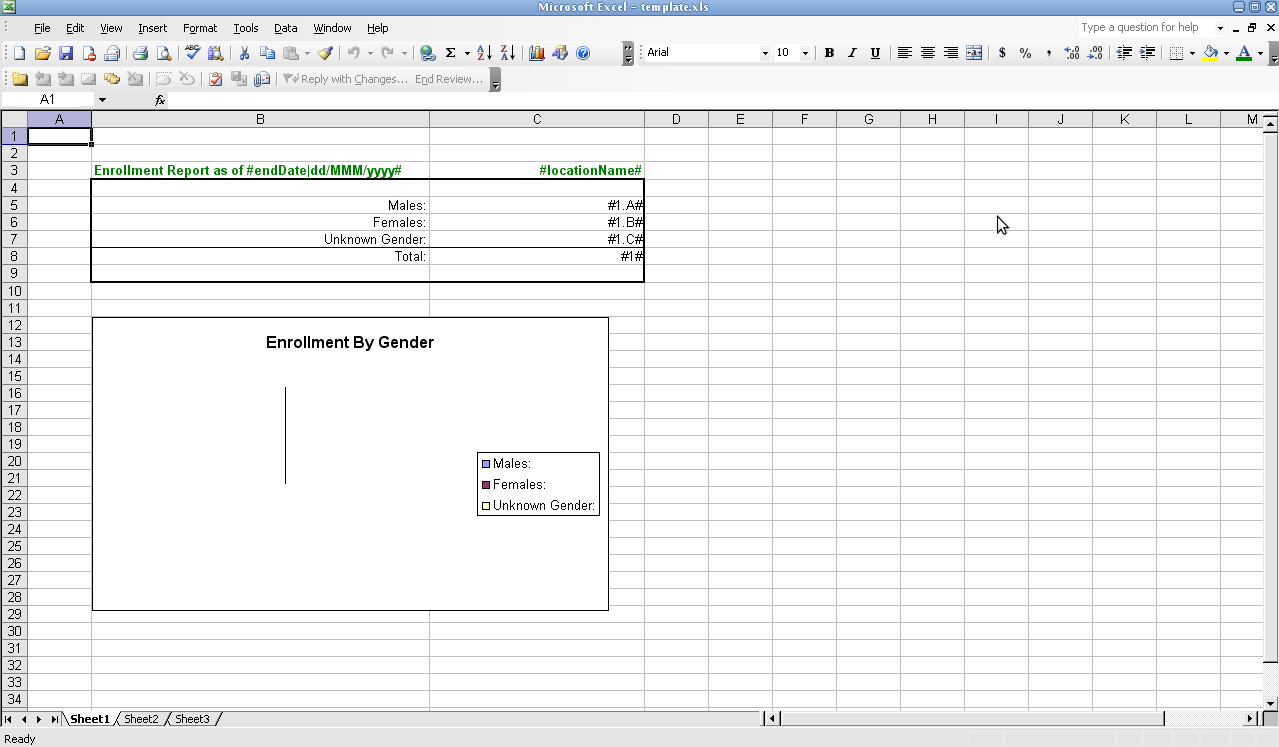
3. Next, we replace each of the numbers which need to be produced by the report with references to our indicator numbers. These are referenced by #1#, #1.A#, #1.B#, and #1.C#. You will see that we can also refer to our parameters - in this case #parameter.endDate|dd/MMM/yyyy# means to display the value of the endDate parameter in a dd/MMM/yyyy format. #parameter.location# means to display the value of the location parameter (*see below for full list of available replacement values*). Note that the graph doesn't look so nice in this view - since we took away the sample numbers that it is based on, and replaced these with the indicator references, the graph breaks. This is not a problem - it will generate correctly when run. Save the excel file as xls (not xlsx). |
|
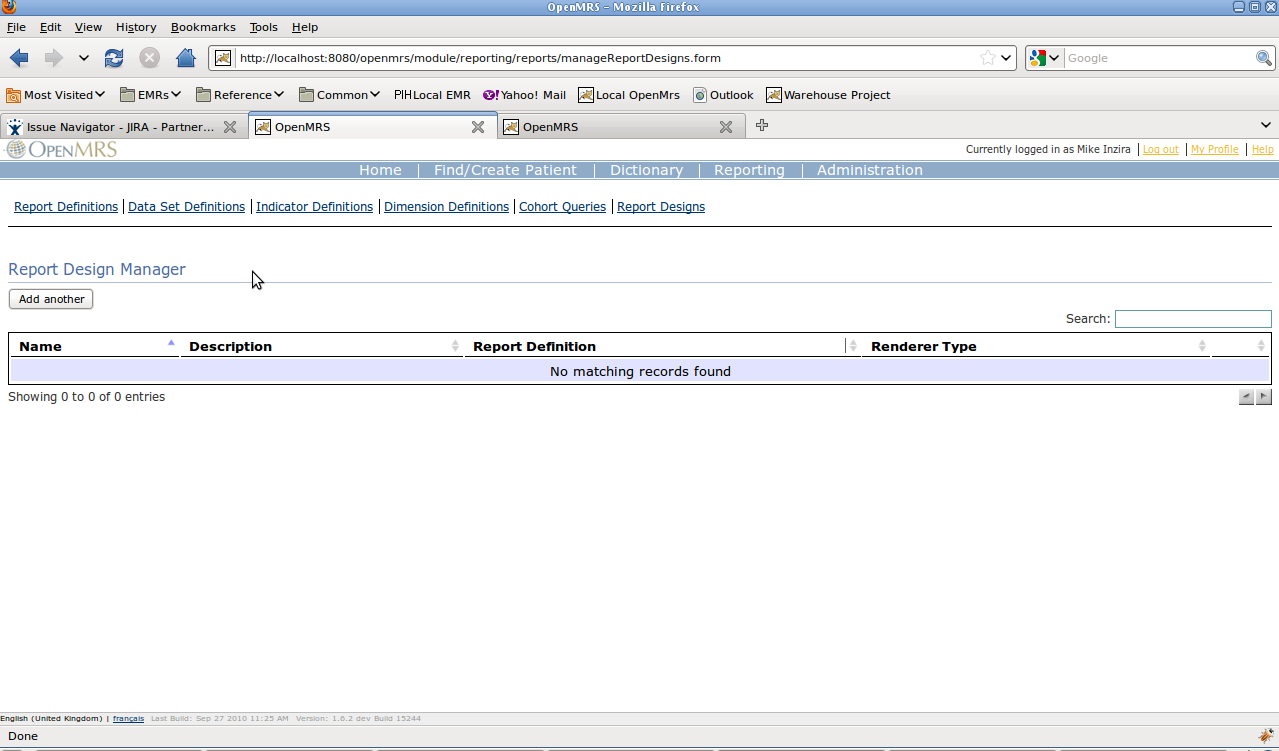
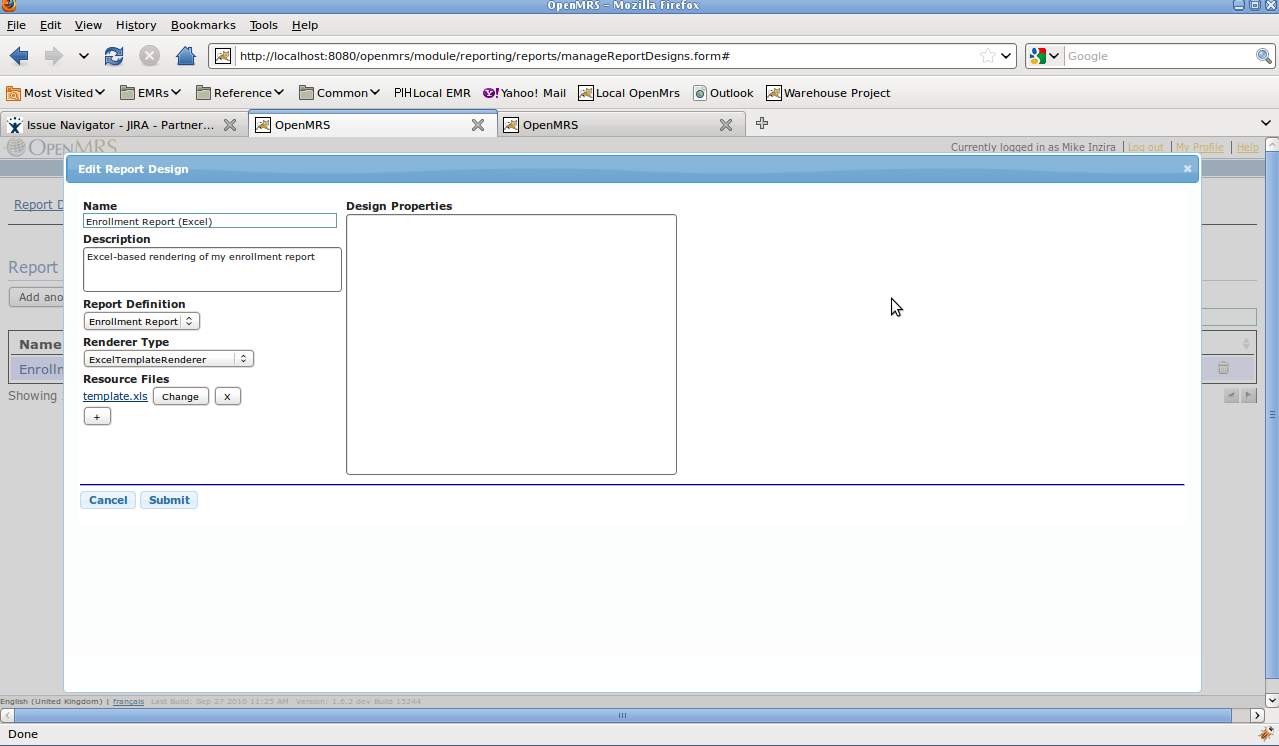
4. In the Report Designs page, click on "Add Another" and you will get a dialog pop-up which will enable you to upload your design as seen in the first image to the right. The fields should be completed as follows:
|
|
...


