Versions Compared

Key

  • This line was added.
  • This line was removed.
  • Formatting was changed.

...

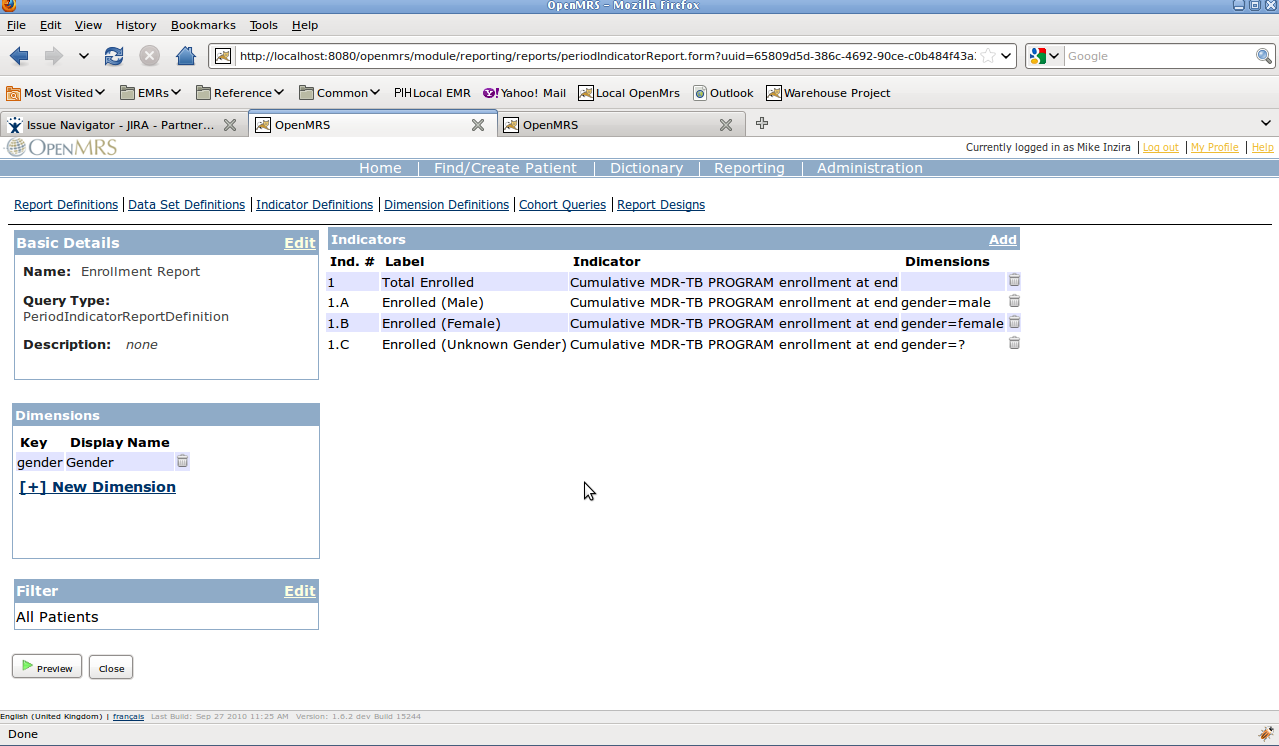
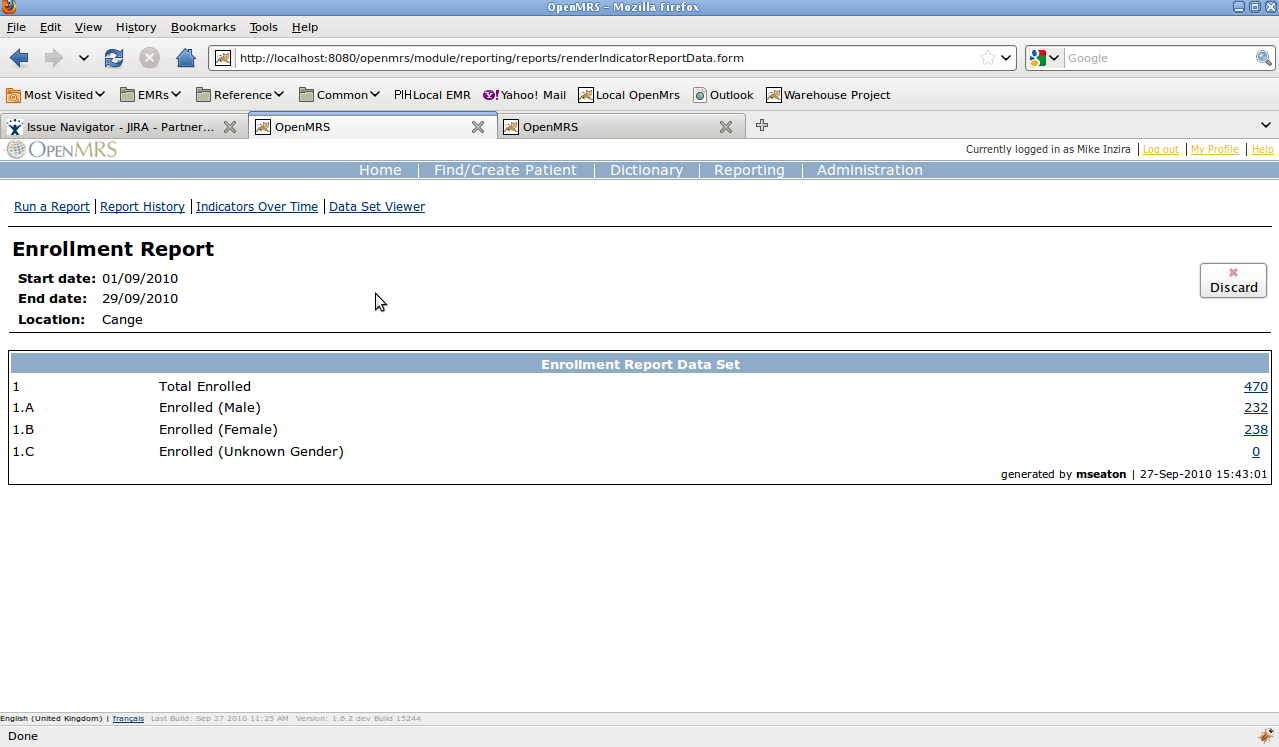
1. Define Period Indicator Report.  Make note of the numbers that you give to each indicator in the report.  To the right, you will see that we have created a sample report with indicators numbered 1, 1.A, 1.B, and 1.C.  Running this report with the default "Indicator Web Report" view, confirms that this report runs and produces correct numbers for each of our our numbered indicators.

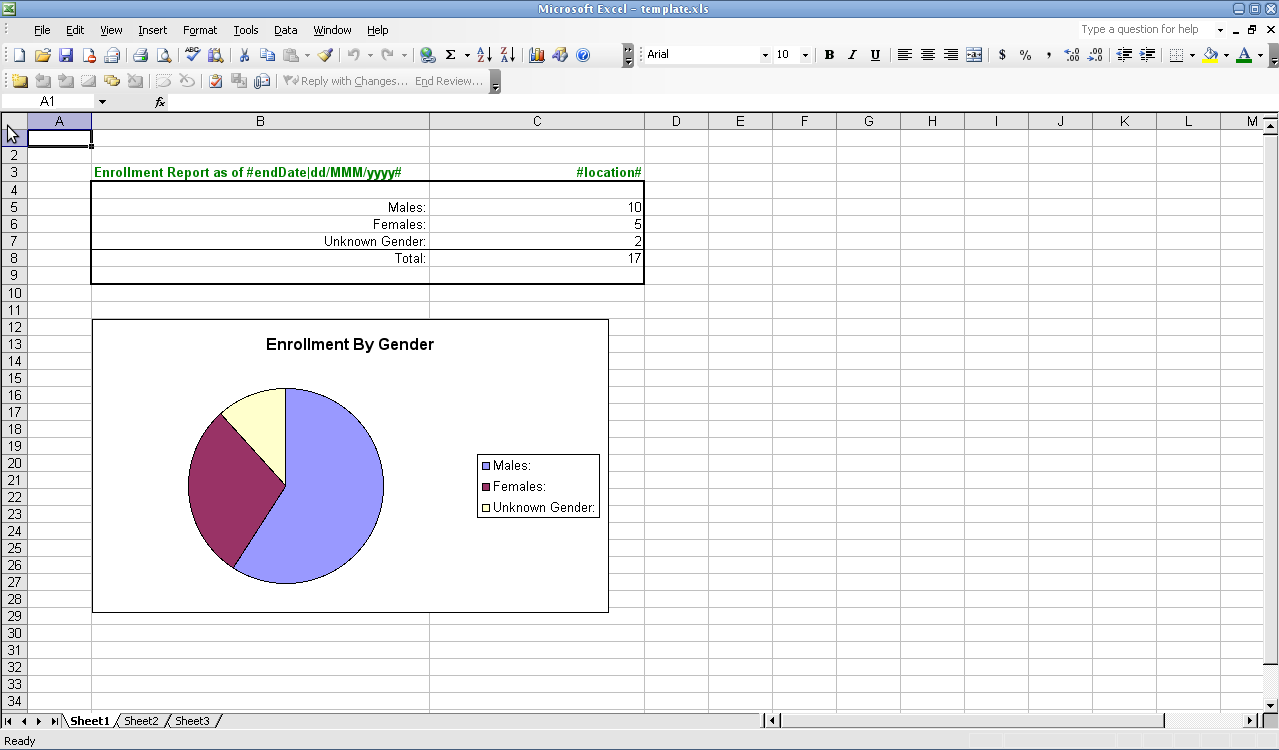
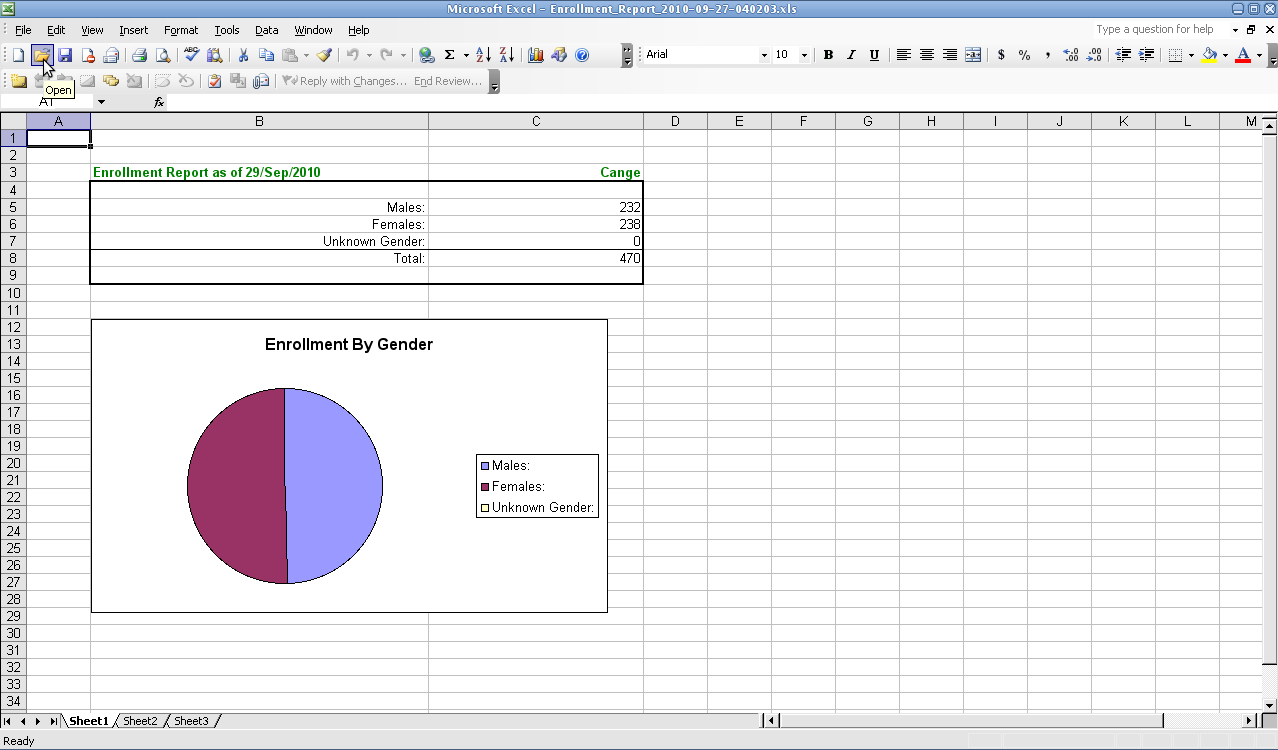
2.  Once you have configured your report, and know  After the report is configured and the names of each of your parameters and numbers of each of your indicators are defined, you can build the Excel-based template.  This involves a couple of steps.  In the first image to the right, we have used sample numbers to create the report in Excel in exactly the format in which we want it to appear.  We incorporate fonts, colors, borders, calculations, and even graphs which are calculated off our or indicator numbers when generated.

...

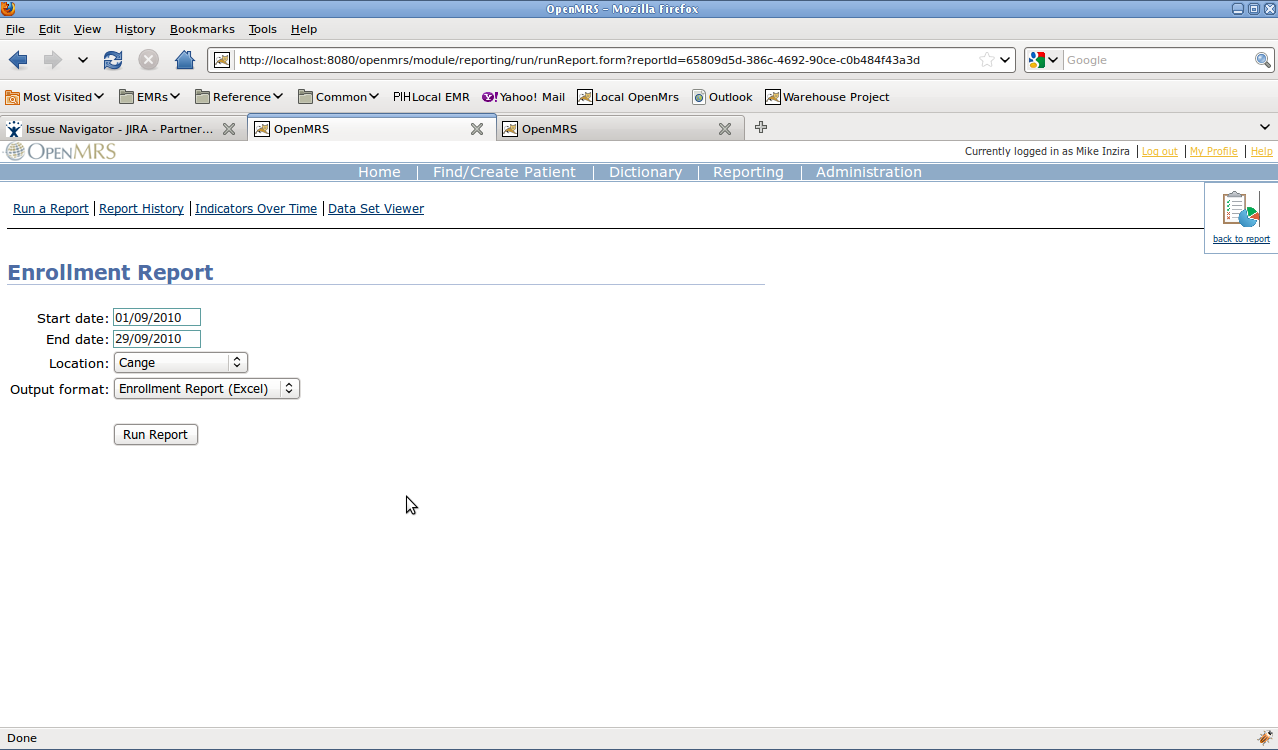
5.  Return to Run a Report.  Choose the newly created report.  The Excel template that was uploaded is available in the list of "Output Formats".  Running the report and choosing this format should produce an Excel Report output like the one shown to the right.


Special hints for row-per-domain

If you want to show multiple rows on the final excel spreadsheet, define the location on the template along with dataSetName in the Design Properties text area.  In the attached example, the following format is used:

repeatingSections=
sheet:[number} where the number is the order of the worksheet on the excel template.  Do not use the name of the worksheet. (ie. sheet:1)
row:[number] where the number is the starting row on the excel worksheet where the data should be added
dataset:[dataSetName] where the dataSetName is the name used in the report
You can handle "row-per-xyz", "row-per-encounter", etc. datasets that have a variable number of rows by setting some properties on the ReportDesign.  What you need to do is to add a property called "repeatingSections", where each "section" you want to repeat is separated by a "pipe" and contains a bunch of comma-separated attributes like this:

sheet:1,row:6-8,dataset:allPatients   - this tells the renderer to repeat every row in the dataset that the report knows as "allPatients", using rows 6-8 in sheet #1 as a template (you will end up with lots of rows)

sheet:2,column:4:dataset:malePatients  - this tells the renderer to repeat every row in the dataset that the report knows as "malePatients", using column #4 in sheet #2 as a template (you will end up with lots of columns)

sheet:3,dataset:femalePatients  - this tells the renderer to repeat every row in the dataset that the report knows as "femalePatients" using sheet #3 as a template (you will end up with lots of sheets).

If you have a dataset added to the report with the "key" of "rowPerReceptionEncounter", and with dataset columns named "receiptNum" and "paymentType". the Excel document starts outputting these on line 5 of the first workbook of your Excel document in columns 2 and 3 of these rows.  Do the following 2 things:

  1. Add the following "property" to your ReportDesign:  repeatingSections=sheet:1,row:5,dataset:rowPerReceptionEncounter
  2. on your actual Excel template, on sheet 1:
    1.  In row 5, column 2, put the value:  #receiptNum#
    2.  In row 5, column 3, put the value:  #paymentType#


Image Added


Available replacement values

...