| Table of Contents | ||||||||
|---|---|---|---|---|---|---|---|---|
|
...
| Anchor | ||||
|---|---|---|---|---|
|
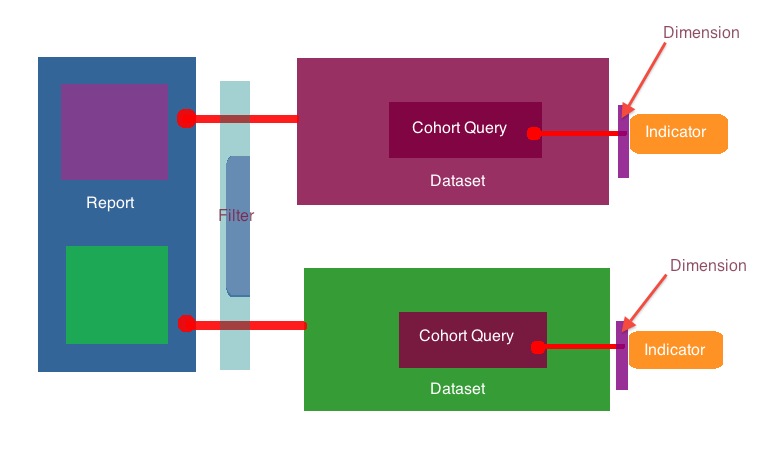
Report Definition
Report Definitions are the outermost layer of your report. They contain one or more DataSet Definitions, which contain the data for your report.
| Anchor | ||||
|---|---|---|---|---|
|
DataSet Definition
A DataSet Definition maps out what information will be in your report. It will directly contain the data for your report or will contain lower level components which contain the data for your report. An example of a DataSet Definition directly holding data is a Row-Per-Patient report. An example of a DataSet Definition containing lower level components holding data is a Cohort Indicator report, which has associated Indicators requiring cohorts.
Examples:
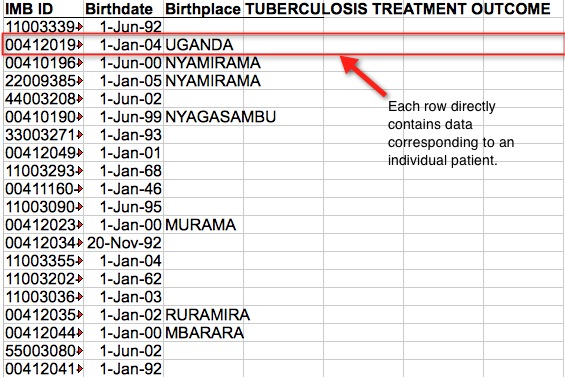
Directly holding data (Row-per-Patient) | |
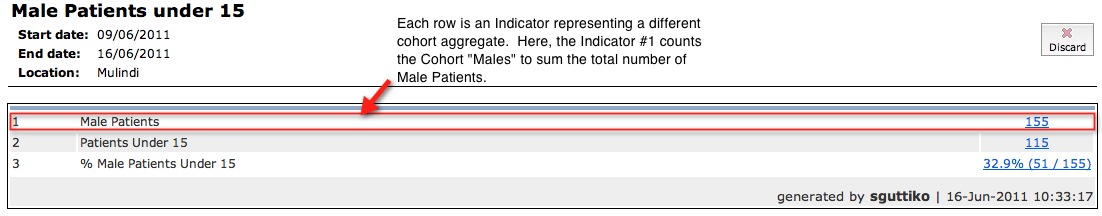
Indirect (Cohort Indicator Report) | |
| Anchor | ||||
|---|---|---|---|---|
|
Cohort Query
Cohorts are the building blocks of an Indicator Report. A cohort is a group of people who meet a certain condition or conditions. When one creates a Cohort Query, such as “number of pediatric patients on ARVs”, the result is a list of patients who meet those criteria (pediatric and on ARV).
Composition Cohorts combine multiple cohorts using the logical operators 'AND', 'OR', and 'NOT'. For instance, there is a cohort of people who weigh less than 30 KG and a cohort of people who are enrolled in the HIV program. You can create a Composition Cohort which returns people who are both in the HIV Program AND weigh less than 30 KG. You can also create a Composition Cohort which returns people who are in the HIV Program but NOT less than 30 KG.
| Anchor | ||||
|---|---|---|---|---|
|
Indicator
An Indicator aggregates the members of a cohort. As a result, a Cohort Query must first be defined to create the cohort which the Indicator will aggregate. The most common form of aggregation is counting. Other aggregate functions include the median, mean, fractions, and logic expressions. For example, an Indicator can count the cohort "Males" and return 521. An Indicator can also return the mean “cost of transport” for a cohort of “tuberculosis patients”, provided the members of this cohort contain the “cost of transport” concept.
| Anchor | ||||
|---|---|---|---|---|
|
Dimension
A Dimension is a filter that narrows the results of an Indicator, such that members of the cohort who do not meet the criteria of the Dimension are removed from the aggregate. For example, the question "Number of male pediatric patients on a first line regimen" can be made up of an Indicator that aggregates the Cohort “patients on first line regimens” while applying the Dimension of age and gender. A Composition Cohort Query that has everything in the Indicator (pediatric, male, and on first line) can be used, but Dimensions are helpful for reuse. For example, in a report with a question about female adult ARV patients, female child ARV patients, male adult ARV patients, and male child ARV patients, it is possible to create four complicated Indicators. However, it is easier to create just one Indicator, “on ARVs”, and then create the appropriate gender and age Dimensions, applied to each question as necessary.
| Anchor | ||||
|---|---|---|---|---|
|
Filter
A Filter narrows the results of every question in the entirety of a Report. For instance, applying the Filter "Not Exited from Care" to a Report ensures that no patient who is no longer a patient of the clinic ends up in the report.
Renderers
Renderers output your report into a specific format. Default formats include Excel and HTML. There are five different formats that come predefined in Open MRS: Excel, HTML, CSV, TSV, and XML. Indicator reports can also be rendered by the Indicator Web Report, which outputs a web report with links to the cohorts that answer each question. Custom renderers can also be made, such as an Excel Template. See Running Reports for more information.
...
Understanding Parameters vs. Fixed Values vs. Expressions
Parameters
Parameters are values which are input at runtime and are then available for use throughout the report. For example, a Cohort Query might have parameters associated with it. For elements that will be reused, parameters are useful.
See Using Parameters in SQL Queries for information about using parameters in SQL Cohort Queries.
Fixed Values
Fixed values are already stored within the elements of the report and cannot be changed at runtime. Fixed values are useful for elements that will be used only once or stay the same.
Example: Parameters and Fixed Values
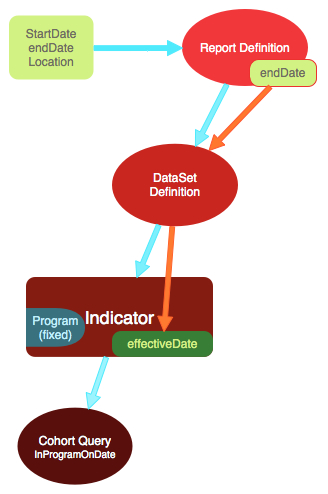
Imagine having a report containing a question about the number of people who are in the HIV Program, TB Program, and Heart Failure Program by a certain date, which can be changed each time the program is run. This date would be represented by the parameter 'endDate,' passed in to the report at runtime.
The report will contain a Cohort Query representing each group of patients per question known as 'InProgramOnDate'. An Indicator which counts these cohorts must contain a fixed value to define the program to which the patients belong, and a parameter 'effectiveDate' to represent the date by which the patients are counted. The 'endDate' input at runtime will be passed from the overlying Report Definition to the DataSet Definition to the Indicator's 'effectiveDate'.
Expressions
Expressions are similar to parameters in that they are placeholders rather than fixed values. Expressions allow you to define values that are relative to parameters. The parameters would then be defined in a higher level element.
Expression examples:
- endDate-1m – One month before the parameter End Date.
- startDate+2w – Two weeks after the parameter Start Date.
- onDate-3y – Three years before the parameter OnDate.
| Anchor | ||||
|---|---|---|---|---|
|
...
Row-Per-Domain Object DataSets
Simple Row Per Patient
A Simple Row Per Patient DataSet returns one row for each patient, with details listed in the associated columns. There are four different types of information which can be included in the Dataset:
- Person/Patient Properties- Examples of patient properties are Birthdate, Gender, GivenName, FamilyName, PatientID (internal), Dead. For a full list, see the OpenMRS 1.6 API for the patient object. Any method that begins with "get" is a property accessed by dropping the word 'get'.
- Person Attribute Types- Available attributes will appear in a drop-down. Examples include Health Center, Birthplace, Civil Status.
- Identifier Types- Available identifiers will appear in a dropdown. Examples include Social Security Number, Government ID, Health Program ID.
- Program Workflow States- Returns the patient's current workflow state as of the day the report is run. Examples include Treatment Status, Evaluation Status, Surgery Status.
See Building a Simple-Row-Per-Report for step-by-step instructions to build a Simple-Row-Per-Patient Report from within OpenMRS or Building Reports for Developers for instructions on how to build reports inside a module.
Logic
Here is where the description will go.
Indicator-Based DataSets
Period Indicator
A Period Indicator DataSet is useful for Indicator Reports with the parameters of Start Date, End Date, and Location. See Building an Indicator Report for step-by-step instructions to build a Period Indicator Report from within OpenMRS or Building Reports for Developers for instructions on how to build reports inside a module.
Cohort Crosstab
Here is where the description will go.
Cohort Indicator with Dimensions
This report is very similar to a Period Indicator Report but does not require Start Date, End Date, nor Location. See Building a Cohort Indicator with Dimensions Report.
Other DataSets
Data Export
Here is where the description will go.
SQL
Here is where the description will go.
Types of Cohort Queries
Cohort Query Types By Domain
...