Troubleshooting High CPU Utilization
OpenMRS is written in Java programming language, Even though Java is a very powerful language its quite popular for these kinds of drawbacks: high resource usage (high CPU utilisation, high RAM usage) because of its design. So in this case to exactly identify the high CPU usage issues within the system, first it would be better to understand the following things as a domain knowledge.
Java high CPU – what is it exactly?
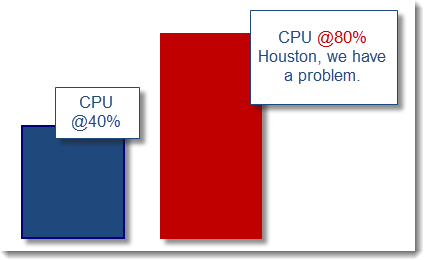
A high CPU problem is defined by an observation of one or many Java VM processes consuming excessive CPU utilization from your physical host(s). Excessive CPU can also be described by an abnormal high CPU utilization vs. a known & established baseline. Ex: if the average CPU utilization of your Java VM under peak load condition is 40% then excessive CPU threshold can be set around 80%.
A typical Java VM process contains several Java Threads, some waiting to do work and others currently executing tasks. The # of Threads can be very low in the event of a single Java program and very high for Java EE enterprise platforms processing heavy concurrent transactions.
In order to understand and identify the source of high CPU of one or many of your Java processes, you will need to understand and perform a full breakdown of all Threads of your Java VM so you can pinpoint the biggest contributors. This analysis exercise can be visualized as per below diagram.
(Referenced from: http://java.dzone.com/articles/high-cpu-troubleshooting-guide)
____
To rectify the issues with your high CPU utilized OpenMRS server you need to follow these steps (Please mind to follow these steps before restarting the server or tomcat, otherwise there will be no point on doing it!) If you have already restarted your server then do these stuff whenever occur this again. So we can dig up into source of the problem.
There's well written article on SO about it, so you can easily follow it: http://code.nomad-labs.com/2010/11/18/identifying-which-java-thread-is-consuming-most-cpu/
In short what you need to do is.
- run
top -H (on *nix terminal) - get PID of the thread with highest CPU
- get stack dump of java process:
jstack <Chosen PID> : It is highly recommended to take more than 1 thread dump, Please see below for more detailed guide on getting multiple dumps. - convert the chosen PID to HEX : 0x + http://www.binaryhexconverter.com/decimal-to-hex-converter
- in stack dump look for thread with the matching HEX PID.
Getting stack dump of Java process.
(Referenced from: https://helpx.adobe.com/experience-manager/kb/TakeThreadDump.html)
There are several ways to take thread dumps from a JVM. It is highly recommended to take more than 1 thread dump. A good practice is to take 10 thread dumps at a regular interval (eg. 1 thread dump every 10 seconds).
jstack script
Here's a script, taken from eclipse.org that will take a series of thread dumps using jstack.
#!/bin/bash
if [ $# -eq 0 ]; then
    echo >&2 "Usage: jstackSeries <pid> <run_user> [ <count> [ <delay> ] ]"
    echo >&2 "    Defaults: count = 10, delay = 0.5 (seconds)"
    exit 1
fi
pid=$1          # required
user=$2         # required
count=${3:-10}  # defaults to 10 times
delay=${4:-0.5} # defaults to 0.5 seconds
while [ $count -gt 0 ]
do
    sudo -u $user jstack -l $pid >jstack.$pid.$(date +%H%M%S.%N).txt
    sleep $delay
    let count--
    echo -n "."
done
Copy the above script to a file and save it as "jstackSeries.sh"
Just run it like this:sh jstackSeries.sh [pid] [cq5serveruser] [count] [delay]
- 1234 is the pid of the java process
- cq5serveruser is the Linux or Unix user that the java process runs as
- 10 is how many thread dumps to take
- 3 is the delay between each dump)
For example:sh jstackSeries.sh 1234 user 10 3
Collect those logs to analyse the issue: The logs will be saved on the location where you executed this command in terminal.
After that you can report us with your findings / File a ticket on OpenMRS jira. Otherwise its very difficult to exactly say what causing this problem. Also note that other than OpenMRS system issues, also it could be your Ubuntu server configuration error/issues of other installed applications/Java-JRE issue/etc. causing this issue.
- Related OpenMRS Talk discussion: Java using 100% of CPU - OpenMRS > https://talk.openmrs.org/t/java-using-100-of-cpu/1692/10

